Review Inventory, Receipts and Sales for all Plant Food Items for a Monthly or Quarterly Sales.
| Access |
| Grant permission to User Profiles in Access User Profiles > select a User Profile > Menu Security > Reports module > Main Menu > Fertilizer. |
| Grant permission to the individual report > Fertilizer > Retail DPR. |
Transportation Mode- Use the drop down menu to select the Transportation Mode. For users with access to multiple sites, selecting a Transportation Mode will limit the information displayed to only the Locations with the matching information.
Choose either
- All
- Truck
- Rail
- Truck and Rail
Based on the User's security, the checkbox for View Top 25 may be available. Select to view only the Top 25 records based on overall Sales.
Select either Quarterly Average or Monthly Average in the Sales Figures drop down menu.
Select a Beginning and Ending Year for the grid.
 Be aware that the grid is based on the Fiscal Year which may be different from the Calendar year.
Choose how to group the information on the report
| First Group | Second Group | Third Group |
|
|
|
|
|
|
|
|
|
|
 - Select to load data on the grid.
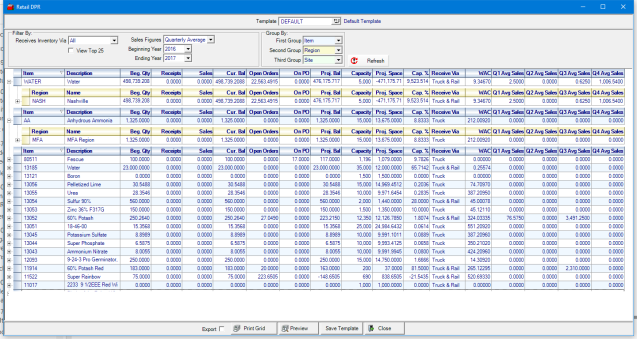
Expand the plus sign to the left of the grid to view Fertilizer information based on the Group By selections.
The Grid displays the following information as Columns.
- Item ID (pending Grouping Option) and Item Description (pending Grouping Option)
- Location ID (pending Grouping Option) and Location Name (pending Grouping Option)
- Region ID (pending Grouping Option) and Region Name (pending Grouping Option)
- Beginning On Hand Quantity
- Current Period Receipts Quantity
- Current Period Sales Quantity
- Current Inventory Balance
- Open Orders
- On Purchase Orders
- On EPO from Wholesale
- Projected Balance is calculated using the formula (Current Inventory Balance – Unbilled Orders / Batches + On EPO from Wholesale)
- Bulk Capacity displays Item Capacity for items at each site
- NH3 Nurse Cap column displays
-
- Site grouping displays in the NH3 Nurse Tank field for the item site indicated
- Region grouping indicates the sum value of the NH3 Nurse Tank field for all item sites associated with the Region indicated
- Item grouping is the sum value of the NH3 Nurse Tank field for all item sites
- Projected Space is calculated using the formula (Capacity – Projected Balance)
- Capacity % - Projected Balance / Capacity
- Receive Via-T / R / T&R – (Truck, Rail, Truck and Rail) based on the Location
- Weighted Average Cost of the Item
Sales Figure columns
Sales figures will be displayed depending on the selection in Sales Figure the Dates selected.
• Option 1 Quarterly Average
This will display 4 columns one for each quarter of the fiscal year. Each column is labeled with a Fiscal Quarter and displays year averaged sales for that quarter.
• Option 2 Monthly Average
Displays a Monthly Average Sales and Current Average Sales
Export a copy of the DPR grid by selecting the Export checkbox and select the location the grid will be saved.